System monitor tracks what programs are running, how resources are used, and system status information. It also regularly tests services meant to be running and automatically generates alerts for problems so you can address them quickly.
Go to Settings >> System Settings from the navigation bar and click System Monitor.
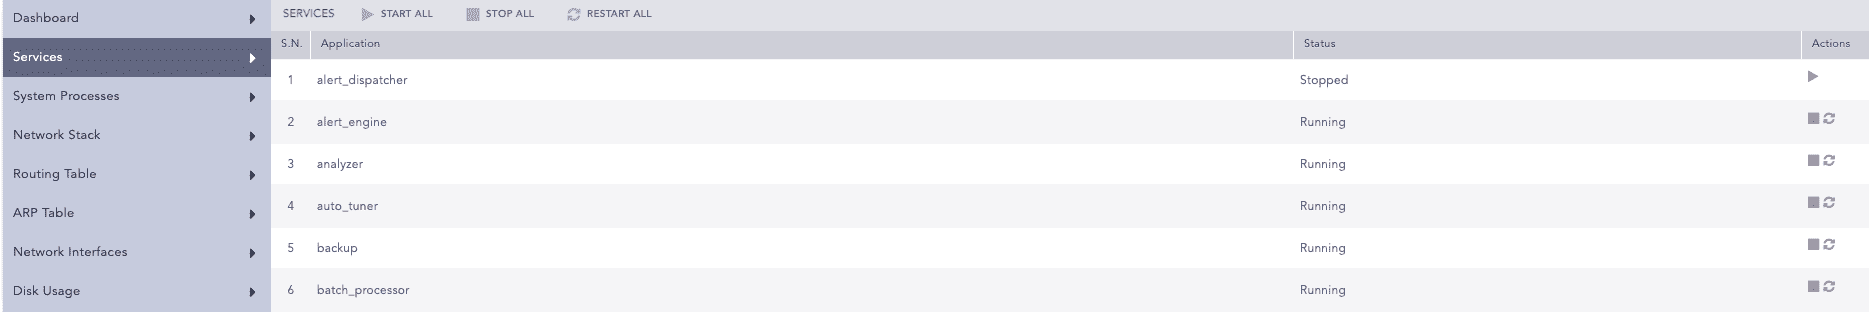
A Service is designed to perform a specific function and works with other services to provide a fully functional Logpoint. If any services performs poorly, it can impact other dependent services, leading to issues in Logpoint’s functionalities. For that reason, it is essential for services to always function. Services lists all running services and their status. You can stop, start, or restart them if you need to.
Services
Starting Services
Click the Start Service ( ) icon from Actions.
To start all the services, click START ALL.
Stopping Services
Click the Stop Service ( ) icon from Actions.
To stop all the services, click STOP ALL.
Restarting Services
Click the Restart Service ( ) icon from Actions.
To restart all the services, click RESTART ALL.
It shows all the processes currently running on the operating system where Logpoint is installed. The process list shows users, memory used by processes, commands on run, and process ids.
You can reload the page by clicking Reload.
The Network Stacks are used in communication networks.
It displays the routes to particular network destinations.
A protocol for mapping an Internet Protocol address (IP address) to a physical machine address that is recognized in the local network. This item data lists all the connection status under this protocol.
Displays Logpoint’s network status. It shows the state of all active interfaces such as eth0, l0, he-ipv6, tun0, tun1 and tun10000.
It displays the total file system disk usage. It lists available disk space, disk usage and location of the file system. By default, Logpoint generates disk notifications when disk usage reaches 80% and again when the disk usage reaches 90%. For more information, go to Disk Usage Notification.
When available disk space falls to less than 2 GB, Logpoint stops collecting or fetching any logs and resumes only when there is at least 4 GB of available space. When the available space for a partition containing a repo path is less than 250 MB, Logpoint stops storing log messages in that partition and generates an audit log specifying that there is insufficient disk space available to store logs. Logpoint resumes data storage when enough space is available.
SNMP (Simple Network Management Protocol) Monitoring is used to monitor the status of your Logpoint. You can use SNMP walk, a command to retrieve values from an SNMP-enabled device by querying all OIDs (Object Identifiers) under a specific base. OIDs are unique, hierarchically structured numbers that identify particular object and component on a device. They are represented as a series of numbers separated by periods.
Use the base OID 1.3.6.1.4.1.54322.1 and the community string to get a list of all the exposed OIDs and their corresponding details. You can also use enterprises.54322.1 as the base OID. The MIB file with the OIDs is on the Service Desk. Monitoring tools interpret OIDs using MIB files, and some OIDs must end with .0 to ensure proper data retrieval. Logpoint provides two OIDs to maintain consistency: one with .0 and one without. For example, 1.3.6.1.4.1.54322.1.1 and 1.3.6.1.4.1.54322.1.1.0 represent the normalizer’s last recorded messages per second.
To monitor Logpoint using SNMPwalk:
Go to Settings >> System Settings from the navigation bar and click System Settings.
Select SNMP and enable SNMPD Port.
Enter a Community String. Copy the passphrase to use it in the SNMPwalk command.
Run the following SNMPwalk Command
snmpwalk -v2c -c <Community String> <IP address of Logpoint>:161 <OID>
If data is not available for the OID, No Such Instance currently exists at this OID is displayed as an output. When running the command for the first time, you might get a request time out.
Logpoint exposes the following OIDs:
SN |
OID |
Information |
|---|---|---|
1 |
1.3.6.1.4.1.54322.1.1 |
Last recorded messages per second in the normalizer |
2 |
1.3.6.1.4.1.54322.1.2 |
Average messages per second in the last 5 minutes in the normalizer |
3 |
1.3.6.1.4.1.54322.1.3 |
Last recorded messages per second in the store handler |
4 |
1.3.6.1.4.1.54322.1.4 |
Average messages per second in the last 5 minutes in the store handler |
5 |
1.3.6.1.4.1.54322.1.5 |
Services that are currently down |
6 |
1.3.6.1.4.1.54322.1.6 |
Logpoint version |
7 |
1.3.6.1.4.1.54322.1.7 |
Status of the log collection services |
8 |
1.3.6.1.4.1.54322.1.7.1 |
CPU consumption in collection (in %) |
9 |
1.3.6.1.4.1.54322.1.7.2 |
Memory consumption in collection (in %) |
10 |
1.3.6.1.4.1.54322.1.7.3 |
Queue in collection (in MB) |
11 |
1.3.6.1.4.1.54322.1.8 |
Status of the normalization services |
12 |
1.3.6.1.4.1.54322.1.8.1 |
CPU consumption in normalization (in %) |
13 |
1.3.6.1.4.1.54322.1.8.2 |
Memory consumption in normalization (in %) |
14 |
1.3.6.1.4.1.54322.1.8.3 |
Queue in normalization (in MB) |
15 |
1.3.6.1.4.1.54322.1.9 |
Status of enrichment services |
16 |
1.3.6.1.4.1.54322.1.9.1 |
CPU consumption in enrichment (in %) |
17 |
1.3.6.1.4.1.54322.1.9.2 |
Memory consumption in enrichment (in %) |
18 |
1.3.6.1.4.1.54322.1.9.3 |
Queue in enrichment (in MB) |
19 |
1.3.6.1.4.1.54322.1.10 |
Status of indexing services |
20 |
1.3.6.1.4.1.54322.1.10.1 |
CPU consumption in indexing (in %) |
21 |
1.3.6.1.4.1.54322.1.10.2 |
Memory consumption in indexing (in %) |
22 |
1.3.6.1.4.1.54322.1.10.3 |
Queue in indexing (in MB) |
23 |
1.3.6.1.4.1.54322.1.11 |
Status of the dashboard and alerting service |
24 |
1.3.6.1.4.1.54322.1.11.1 |
CPU consumption for dashboards and alerts (in %) |
25 |
1.3.6.1.4.1.54322.1.11.2 |
Memory consumption for dashboards and alerts (in %) |
26 |
1.3.6.1.4.1.54322.1.11.4 |
Disk usage by dashboards and alerts |
27 |
1.3.6.1.4.1.54322.1.11.5 |
Number of active search processes (live searches) |
28 |
1.3.6.1.4.1.54322.1.12 |
ZFS pool statistics |
29 |
1.3.6.1.4.1.54322.1.12.1 |
Names of the ZFS pools |
30 |
1.3.6.1.4.1.54322.1.12.2 |
Status of the ZFS pools |
31 |
1.3.6.1.4.1.54322.1.12.3 |
Disk allocation for the ZFS pools |
32 |
1.3.6.1.4.1.54322.1.12.4 |
Free disk space in the ZFS pools |
33 |
1.3.6.1.4.1.54322.1.12.5 |
Read operations in the ZFS pools |
34 |
1.3.6.1.4.1.54322.1.12.6 |
Write operations in the ZFS pools |
35 |
1.3.6.1.4.1.54322.1.12.7 |
Read bandwidth in the ZFS pools |
36 |
1.3.6.1.4.1.54322.1.12.8 |
Write bandwidth in the ZFS pools |
37 |
1.3.6.1.4.1.54322.1.12.9 |
Failed disks in the pools (if any) |
38 |
1.3.6.1.4.1.54322.1.13 |
Statistics for the log size in repos |
39 |
1.3.6.1.4.1.54322.1.13.1 |
Names of the repos |
40 |
1.3.6.1.4.1.54322.1.13.2 |
Log size of repos in the previous day |
41 |
1.3.6.1.4.1.54322.1.13.3 |
Log size of repos in the previous month |
42 |
1.3.6.1.4.1.54322.1.14 |
Status of LUNs in systems with multipath devices |
43 |
1.3.6.1.4.1.54322.1.14.1 |
Name of the multipath |
44 |
1.3.6.1.4.1.54322.1.14.2 |
UUID of the multipath |
45 |
1.3.6.1.4.1.54322.1.14.3 |
SysFS device-mapper’s blocked device name of the multipath |
46 |
1.3.6.1.4.1.54322.1.14.4 |
Device vendor/product/revision information |
47 |
1.3.6.1.4.1.54322.1.14.5 |
Total number of detected paths of the multipath |
48 |
1.3.6.1.4.1.54322.1.14.6 |
Total active paths of the multipath |
49 |
1.3.6.1.4.1.54322.1.14.7 |
Product information |
50 |
1.3.6.1.4.1.54322.1.14.8 |
Status of the multipath |
51 |
1.3.6.1.4.1.54322.1.14.9 |
Size of the multipath |
52 |
1.3.6.1.4.1.54322.1.14.10 |
Automatic failback configuration of the multipath |
53 |
1.3.6.1.4.1.54322.1.15 |
Lists inactive status of the Log Sources and Devices |
54 |
1.3.6.1.4.1.54322.1.30 |
Status of the Logpoint Collector buffer |
55 |
1.3.6.1.4.1.54322.1.30.1 |
The logs in the buffer not received by the main Logpoint |
56 |
1.3.6.1.4.1.54322.1.30.2 |
The time (in seconds) since the last message was received by the main Logpoint |
The OIDs for ZFS pool statistics, statistics for the log size in repos, and LUN status gives information for all the entities. To retrieve the information for a single one, add an extra number corresponding to the respective pool, repo, or LUN after the provided OID.
For example, you can use enterprises.54322.1.12.1 to retrieve the names of all the ZFS pools and enterprises.54322.1.12.1.1 to retrieve the name of the first ZFS pool.
Additionally, you can use the following default OIDs for a Linux-based system:
General Statistics
SN |
OID |
Information |
|---|---|---|
1 |
1.3.6.1.4.1.2021.11 |
CPU and swap information |
2 |
1.3.6.1.2.1.2.2.1 |
Network interfaces information |
3 |
1.3.6.1.2.1.25.2.3.1.6.2 |
Disk usage information |
4 |
1.3.6.1.2.1.25.1.1.0 |
Uptime information |
CPU load
SN |
OID |
Information |
|---|---|---|
1 |
1.3.6.1.4.1.2021.10.1.3.1 |
CPU load over the last minute |
2 |
1.3.6.1.4.1.2021.10.1.3.2 |
CPU load over the last 5 minutes |
3 |
1.3.6.1.4.1.2021.10.1.3.3 |
CPU load over the last 15 minutes |
4 |
1.3.6.1.4.1.2021.11.9.0 |
Percentage of CPU time consumed by user |
5 |
1.3.6.1.4.1.2021.11.50.0 |
Raw CPU time consumed by user |
6 |
1.3.6.1.4.1.2021.11.10.0 |
Percentage of CPU time used by system |
7 |
1.3.6.1.4.1.2021.11.52.0 |
Raw CPU time used by system |
8 |
1.3.6.1.4.1.2021.11.11.0 |
Percentage of idle CPU time |
9 |
1.3.6.1.4.1.2021.11.53.0 |
Raw idle CPU time |
10 |
1.3.6.1.4.1.2021.11.51.0 |
Raw nice CPU time |
Memory statistics
SN |
OID |
Information |
|---|---|---|
1 |
1.3.6.1.4.1.2021.4.3.0 |
Total swap size |
2 |
1.3.6.1.4.1.2021.4.4.0 |
Available swap space |
3 |
1.3.6.1.4.1.2021.4.5.0 |
Total RAM in the machine |
4 |
1.3.6.1.4.1.2021.4.6.0 |
Total RAM used |
5 |
1.3.6.1.4.1.2021.4.11.0 |
Total free RAM |
6 |
1.3.6.1.4.1.2021.4.13.0 |
Total shared RAM |
7 |
1.3.6.1.4.1.2021.4.14.0 |
Total RAM buffered |
8 |
1.3.6.1.4.1.2021.4.15.0 |
Total cached memory |
Disk statistics
SN |
OID |
Information |
|---|---|---|
1 |
1.3.6.1.4.1.2021.9.1.6.1 |
Total size of the disk or partition (in KB) |
2 |
1.3.6.1.4.1.2021.9.1.7.1 |
Available space on the disk |
3 |
1.3.6.1.4.1.2021.9.1.8.1 |
Used space on the disk |
4 |
1.3.6.1.4.1.2021.9.1.9.1 |
Percentage of used space on the disk |
5 |
1.3.6.1.4.1.2021.9.1.10.1 |
Percentage of inodes used on the disk |
6 |
1.3.6.1.2.1.1.3.0 |
System uptime |